Workforce Drug Testing Positivity Climbed to Highest Rate in 16 Years… Even Before Pandemic
NEWS PROVIDED BY: Quest Diagnostics 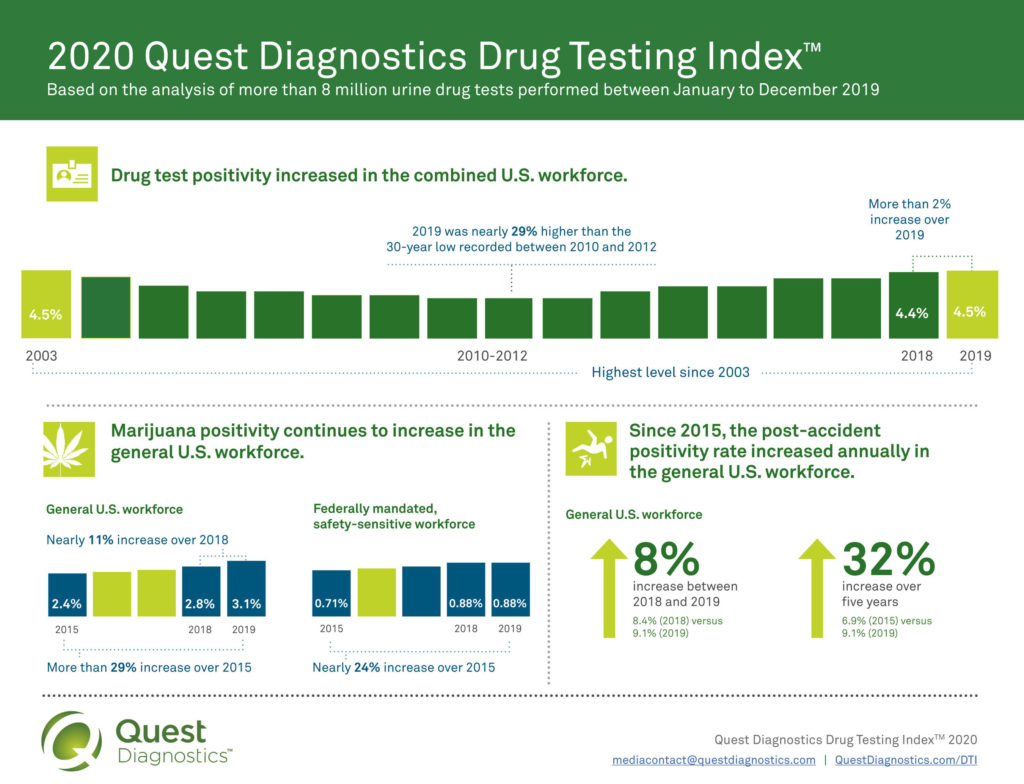
-
New Quest Diagnostics Drug Testing Index™ Analysis Finds that Workforce Drug Testing Positivity Climbed to Highest Rate in 16 Years Even Before COVID 19 Pandemic
-
Marijuana positivity climbed by double digits across nearly all employee testing categories, while opiate and heroin positivity decline
-
Analysis of more than nine million workplace drug test results showed cocaine and methamphetamine positivity surges in Midwest
SECAUCUS, N.J., Aug. 25, 2020 /PRNewswire/ — The rate of workforce drug positivity hit a sixteen-year high in 2019, according to a new analysis released today by Quest Diagnostics (NYSE: DGX), the world’s leading provider of diagnostic information services. Positivity rates in the combined U.S. workforce increased in urine drug tests, climbing to the highest level since 2003 (4.5%) and more than 28% percent higher than the thirty-year low of 3.5 percent recorded between 2010 and 2012.
In addition to overall increases in workforce drug positives, specific regions of the United States, particularly the Midwest, experienced dramatic increases in positivity for cocaine and methamphetamine as well as marijuana.
The new findings of the Quest Diagnostics Drug Testing Index which include an analysis of industry-specific data, were unveiled in advance of the Substance Abuse Program Administrators Association (SAPAA) virtual conference taking place on August 25, 2020.
The Quest Diagnostics findings generally align with other research. Drug deaths in the United States rose 5 percent in 2019, driven largely by methamphetamine, cocaine and fentanyl, following a decline in 2018. During the first few months of 2020, drug deaths increased about 13 percent compared with last year, attributable partly to social isolation and other disruptions caused by COVID-19.
“There is no question that before COVID-19, rates of workplace drug positivity were trending in the wrong direction, based on our Quest Diagnostics data, The enormous strain caused by COVID-19 may prove to be an accelerant on this disturbing trend,” said Dr. Barry Sample, senior director of science and technology, Quest Diagnostics. “Organizations will need to consider the impact of COVID-19 not only on workplace safety but also as a health concern for their employees for some time to come.”
Positivity rates for methamphetamine surged in the Midwest
 Over the last five years, methamphetamine positivity in the general U.S. workforce testing increased nearly 12 percent (0.17% in 2015 versus 0.19% in 2019). The Midwest region experienced year-over-year increases, driven primarily by double-digit increases in the East North Central region during this period. Over the past five years, methamphetamine positivity in the Midwest increased nearly 78 percent (0.09% in 2015 versus 0.16% in 2019). Illinois (0.03% in 2015 versus 0.10% in 2019), Indiana (0.14% in 2015 versus 0.29% in 2019), Michigan (0.014% in 2015 versus 0.05 in 2019), and Ohio (0.04% in 2015 versus 0.11% in 2019) increased at least two-fold; while Wisconsin (0.05% in 2015 versus 0.09% in 2019) nearly doubled.
“While the national debate on drug misuse in the workforce has focused primarily on marijuana, increasing positivity rates for cocaine and methamphetamine are also cause for concern,” said Dr. Sample. “Positivity by drug and region can be random and unpredictable. Our data is a reminder that it is important to remain vigilant about all drug misuse in the workforce.
Between 2019 and 2018. methamphetamine positivity inched up nearly 6 percent (0.18% in 2018 versus 0.19% in 2019) in general U.S. workforce tests and fell 6.3 percent (0.15% in 2018 versus 0.16% in 2019) in federally mandated, safety-sensitive testing. Methamphetamine positivity changed little in the general U.S. workforce (up 12 percent) and was flat in federally mandated, safety sensitive testing over five years.
The increased positivity rates for methamphetamine in urine test results were bolstered by similar patterns in other specimen types. Oral fluid methamphetamine positivity, which also assesses recent use, was up 4.3 percent since 2018 and up 69 percent since 2015; while methamphetamine positivity from hair tests, which gauges a pattern of drug use over time, was up 20 percent since 2018 and 60 percent since 2015.
“Testing with multiple specimen types can reveal a fuller understanding of patterns of misuse than one alone,” said Dr. Sample. “Our data suggests that testing for methamphetamine with hair and oral fluid may be appropriate for employers with concerns about misuse of this particular drug to complement the standard urine drug screen.”
Cocaine positivity increased in the Midwest and West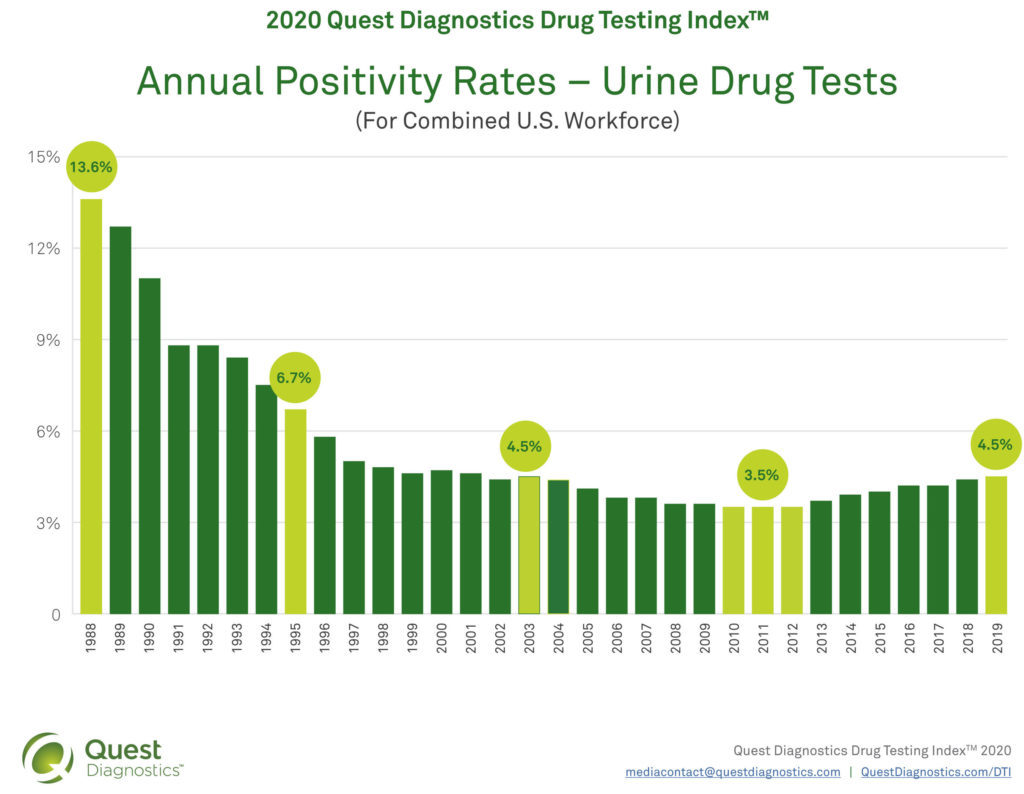
Cocaine positivity in the general U.S. workforce testing increased in the Midwest and West regions over the past five years. Cocaine positivity in the Midwest increased by 40 percent (0.20% in 2015 versus 0.28% in 2019) and in the West by 53 percent (0.15% in 2015 versus 0.23% in 2019). The Midwest was 20 percent less than the national rate in 2015 but 3.7 percent above the national rate in 2019, suggesting a surge in positivity in the region last year.
In the West, where cocaine positivity has been historically far lower, the cocaine positivity rate rose from 40 percent below the national rate in 2015 to 14.8 percent below in 2019. These increases in the West were primarily driven by increasing positivity in Colorado (0.19% in 2015 versus 0.30% in 2019), Nevada (0.13% in 2015 versus 0.22% in 2019), and Oregon (0.09% in 2015 versus 0.13% in 2019).
Opiate positivity declines throughout United States
In the general U.S. workforce, positivity for opiates in urine drug testing continues to decline across all opiate categories. Urine drug test positivity for opiates (primarily codeine and/or morphine) in the general U.S. workforce declined more than 19 percent (0.31% in 2018 versus 0.25% in 2019) and 49 percent over five years (0.49% in 2015 versus 0.25% in 2019). Among the more specific tests for other prescription opiates, the positivity for the semi-synthetic opiates (hydrocodone and/or hydromorphone) dropped 26 percent over the past year (0.50% in 2018 versus 0.37% in 2019) and more than 45 percent over five years (0.68% in 2015 versus 0.37% in 2019). Similarly, positivity for oxycodones (oxycodone and/or oxymorphone) declined 21 percent (0.43% in 2018 versus 0.34% in 2019) over the past year and nearly 55 percent over five years (0.75% in 2015 versus 0.34% in 2019).
Marijuana most commonly detected drug in U.S. workforceMarijuana continues to top the list of the most commonly detected illicit substances across all workforce categories (general U.S. workforce; federally mandated, safety-sensitive workforce; and combined U.S. workforce, which includes the prior two populations) and specimen types (urine, oral fluid, and hair).In the general U.S. workforce, marijuana positivity increased nearly 11 percent in urine testing (2.8% in 2018 versus 3.1% in 2019) and 29 percent since 2015 (2.4%). In the Midwest, marijuana positivity outpaced national increases in positivity in 2018 and 2019. Marijuana positivity increased in the Midwest by nearly 14 percent (2.9% in 2018 versus 3.3% in 2019). The West region also outpaced national positivity and saw double digit increases, as compared to the previous year, in 2017 through 2019. Marijuana positivity increased in the West by 24 percent (3.3% in 2018 versus 4.1% in 2019) and 78 percent since 2015 (2.3%).”Marijuana continues to be an enduring presence in the U.S. workforce. Changing attitudes toward its use could pose heightened risks especially in safety-sensitive positions and those states exploring legalization,” said Dr. Sample.Positivity rates for heroin continue to decline in general U.S. and federally mandated, safety-sensitive workforce testing
Urine drug test results for the general U.S. workforce for heroin use, indicated by the presence of the 6-acetylmorphine (6-AM) metabolite, declined 33 percent (0.03% in 2018 versus 0.02% in 2019) and 50 percent decline since its peak in 2015 and 2016 (0.04%).Positivity for 6-AM in the federally mandated, safety-sensitive workforce declined 15 percent between 2018 and 2019 (0.013% versus 0.011%), with a decrease of more than 45 percent since 2015 (0.02%).
Workforce positivity increases significantly in multiple industries.
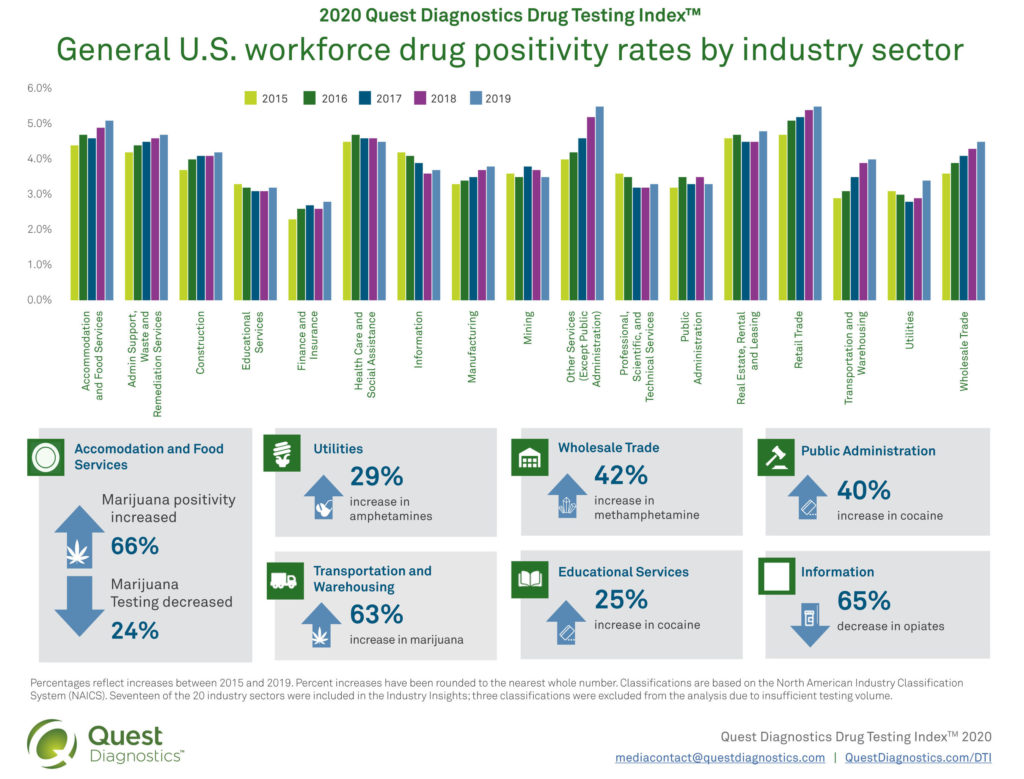
The Quest Diagnostics Drug Testing Index Industry Insights of general U.S. workforce positivity rates, based on more than 18 million urine drug test results (between 2015 and 2019), shows year-over-year increases in overall workplace drug positivity in 15 of the 17 sectors reported. The Retail Trade industry had the highest overall positivity rate (4.7% in 2015, 5.1% in 2016, 5.3% in 2017, 5.4% in 2018 and 5.5% in 2019) across all five years of the analysis. The Other Services (not including Public Administration) category, which includes services not listed in the other categories such as grantmaking, advocacy, and providing personal services, also had a 5.5% positivity rate in 2019. The Accommodations and Food Service category had the highest workforce positivity for marijuana, at 4.8%, a relative increase of 65 percent over five years (2.9% in 2015 versus 4.8% in 2019).
Want to learn more about remote resources to foster better mental health in the workplace?
Get our employer’s guide to substance use in the workplace, written for employers and benefits brokers by filling in the form below:
E-Guide
- share


